What Is Biological Magnification?
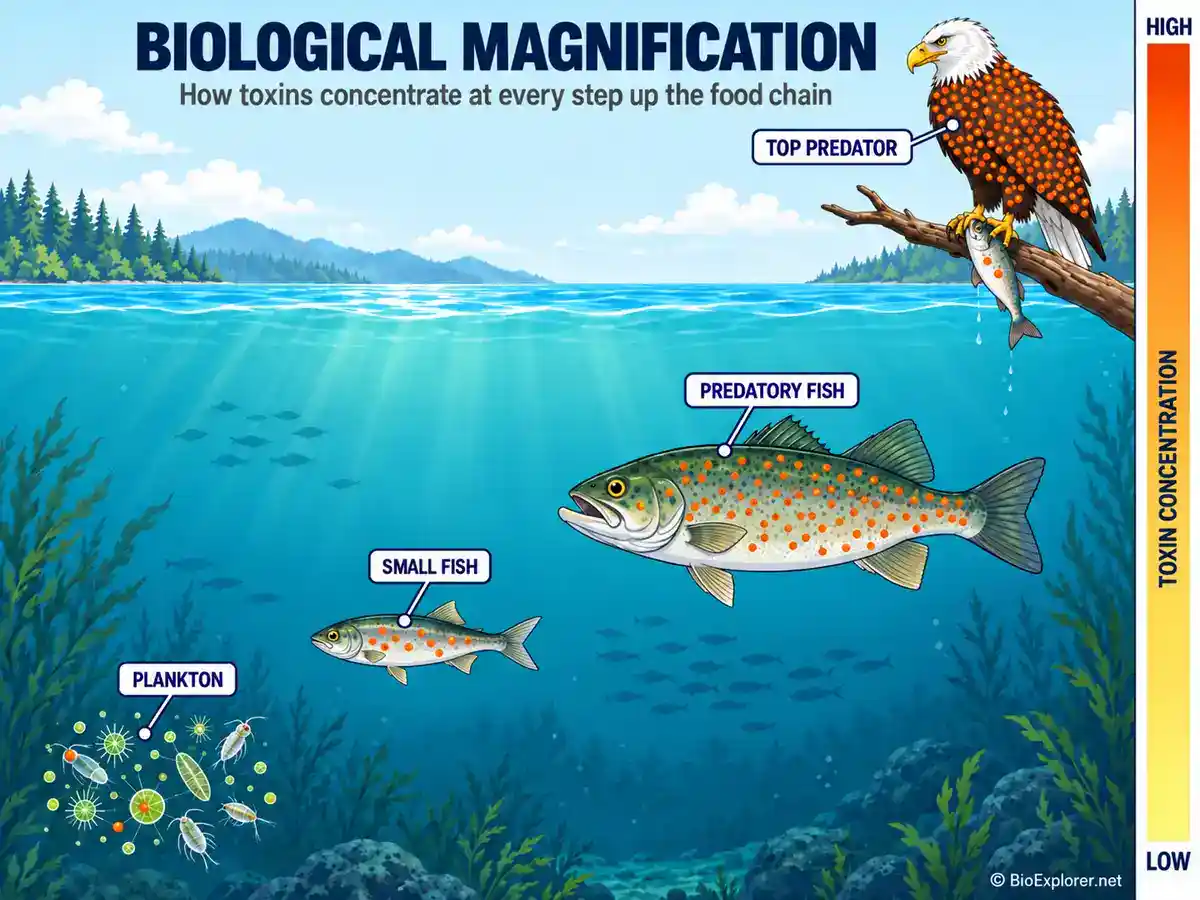
Biological magnification is the increase in the concentration of a chemical at each step up a food chain. The US Environmental Protection Agency defines it as the process where “chemical levels in plants or animals increase from transfer through the food web.” In plain terms, a predator ends up with a higher concentration of the chemical in its tissues than its prey had.
The process is also called biomagnification, biological amplification, or bioamplification. All four terms mean the same thing.
Here is the short version. A tiny amount of a stubborn chemical sits in the water, and algae soak it up. Small fish eat thousands of algae, big fish eat hundreds of small fish, and an eagle eats the big fish.
At each step some of the chemical is retained while most of the food itself is digested and eliminated. By the top of the chain, the concentration can be hundreds or thousands of times higher than it was at the bottom. It helps to picture where each organism sits among the Levels of Biological Organization.
Biological magnification is the progressive increase in the concentration of a substance in organisms at successively higher trophic levels of a food chain. It matters most for persistent, poorly excreted contaminants.
A Real Food Chain, With Real Numbers
Toxicologists at the Agency for Toxic Substances and Disease Registry documented DDT across four trophic levels in a Long Island estuary. The whole-body concentrations were:
| Trophic level | Organism | DDT (mg/kg, whole body) |
|---|---|---|
| 1 | Plankton | 0.04 |
| 2 | Invertebrates | 0.3 |
| 3 | Fish | 4.1 |
| 4 | Fish-eating birds | 24 |
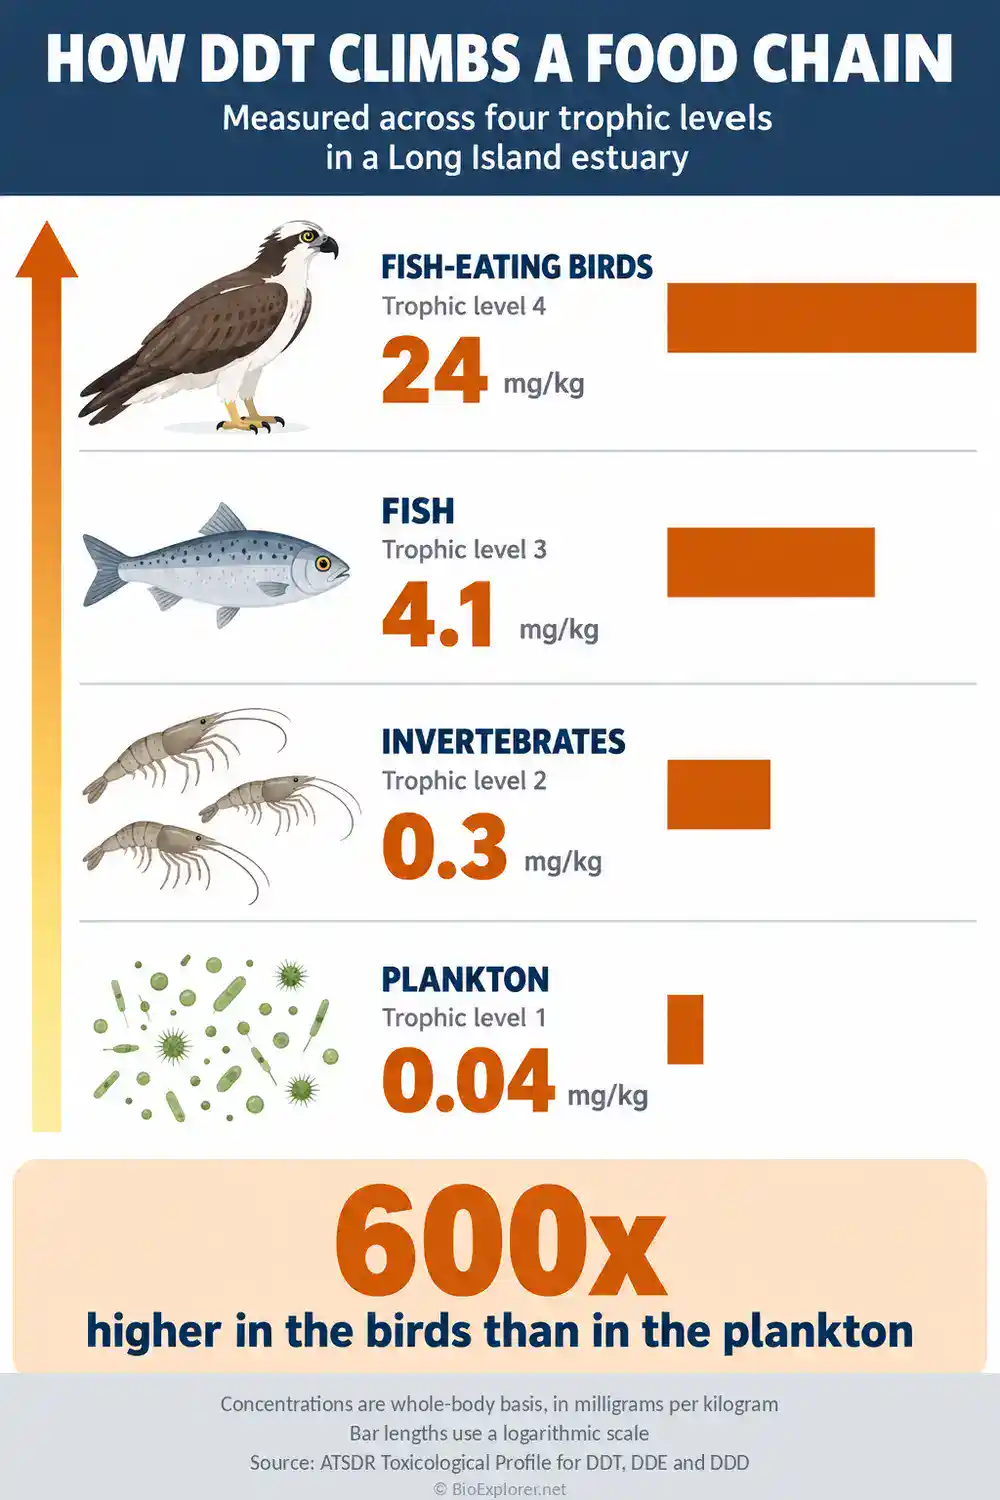
The birds carried 600 times the concentration found in the Plankton. That 600-fold rise across the food web is a classic biomagnification pattern.
Consumers took in DDT with their food. Metabolism and excretion were far too slow to stop tissue concentrations climbing at every level.
Bioaccumulation vs. Biomagnification
Students mix these up constantly. They are different ideas, and exam questions love the difference.
| Feature | Bioaccumulation | Biomagnification |
|---|---|---|
| What it compares | One organism vs. its environment | A consumer vs. its diet, across trophic levels |
| Direction | Builds up over an organism’s lifetime | Builds up across trophic levels |
| Routes | Water, air, soil, and food | Food only |
| Where it happens | Inside a single organism | Along a food chain |
| Example | A clam holds more cadmium than the seawater around it | A tuna holds more mercury than the fish it eats, and a caribou holds more PCBs than the lichen it grazes |
Bioaccumulation describes buildup within one organism. Biomagnification describes rising concentration across trophic levels in a food web.
There is a third term you may meet. Bioconcentration is direct uptake from the surrounding environmental medium, with no dietary uptake counted. For aquatic animals that usually means uptake straight from water, and for a plant it means uptake from soil.
So bioconcentration is a part of Bioaccumulation, and biomagnification sits on a separate axis entirely.
One more point worth knowing. A chemical can bioaccumulate strongly and still not biomagnify. Lead is the standard example, building up in particular tissues without consistently magnifying, and many freshwater food webs show lead concentrations falling rather than rising with trophic level.
How Biomagnification Works
The process runs in four stages.
Stage 1: Release. A persistent chemical enters the environment. It might be a pesticide sprayed on a field, an industrial fluid leaking from old equipment, or mercury falling out of the air from coal burning.
Stage 2: Uptake at the base. Algae, plankton, and bacteria absorb the chemical straight from water or sediment. Strictly speaking this step is bioconcentration, not biomagnification, because no eating is involved yet. EPA puts the bioconcentration factor for methylmercury into the base of freshwater food webs at roughly 33,000.
Stage 3: Transfer with every meal. A zooplankton eats hundreds of algal cells and digests the sugars and proteins. If it breaks down or excretes the chemical slowly, some of every dose stays behind. Repeat that at every level.
Stage 4: Concentration at the top. Long-lived predators keep eating contaminated prey for decades. They accumulate what all their prey accumulated, and the load piles up.
Why the Concentration Climbs
It comes down to a balance between what goes in and what comes out.
A predator eats many contaminated prey over its life. Energy transfer between trophic levels is inefficient, which is why Ecological Pyramids narrow toward the top, and it is why a predator needs so much prey biomass to sustain itself. Every one of those meals delivers another dose of the chemical.
If the animal absorbs that chemical efficiently but breaks it down and excretes it slowly, each meal adds more than the animal clears between meals. Over time its tissue concentration rises above the concentration in its food.
Four factors decide where it settles. The first is how much the animal eats, and the second is how much of the chemical its gut absorbs. The third is how fast it can metabolize and excrete the chemical.
The fourth is how fast it grows, because rapid growth spreads the same load across more body mass and dilutes it. That last factor is easy to overlook. It is one reason fast-growing individuals often carry lower concentrations than slow-growing ones of the same species.
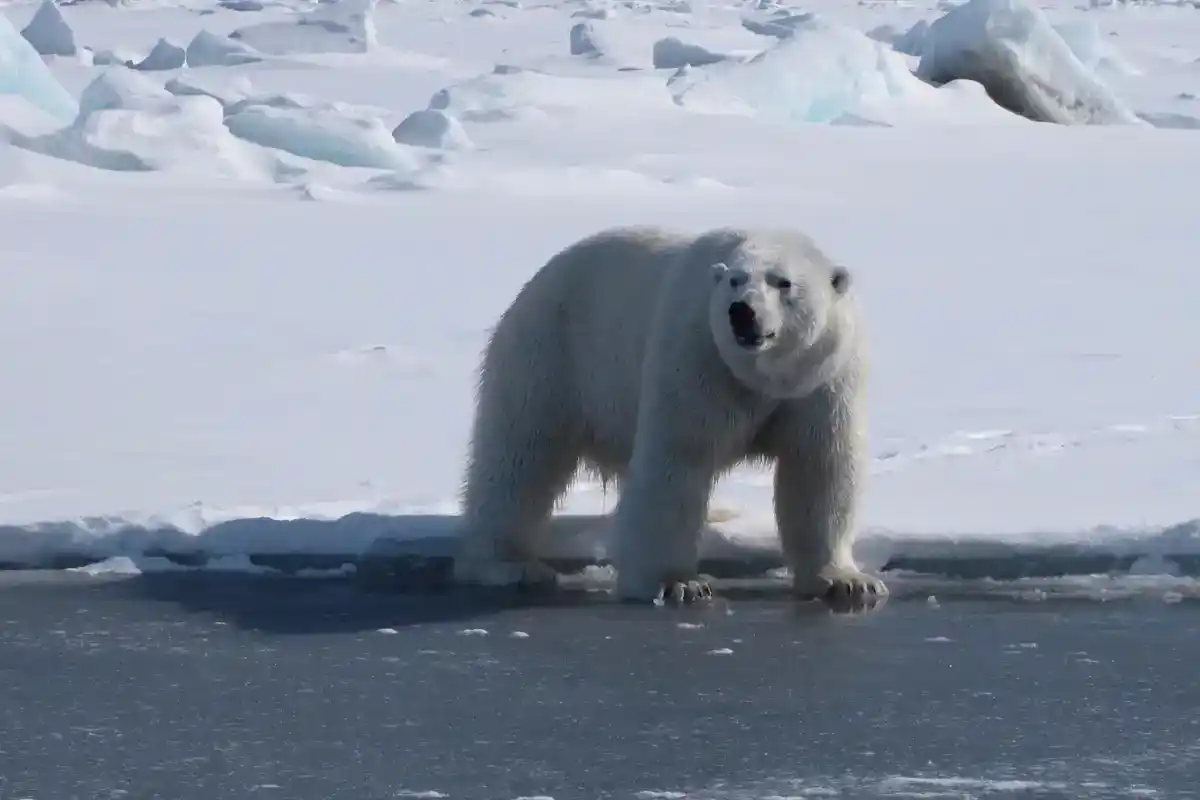
Polar bears illustrate this well. A 2024 study tracked three zoo-housed polar bears through seasonal feeding cycles, and found lipid assimilation efficiency as high as 99.5 percent. It also modeled limiting biomagnification factors as high as 200.
Fat is where many persistent hydrophobic pollutants preferentially accumulate. That extraordinarily efficient lipid assimilation can drive very efficient uptake of hydrophobic pollutants such as PCBs, for which the same study reported uptake efficiencies as high as 98 percent.
What Do Polar Bears Eat? Almost entirely seals, and seal blubber is exactly where these pollutants sit. That is one reason polar bears are among the most contaminated mammals on Earth despite living far from any factory.
What Makes a Chemical Biomagnify
Not every pollutant magnifies. Several chemical and biological traits make it much more likely.
1. It resists metabolism. This is the most important trait by far.
A 2016 global analysis reviewed more than 1,500 trophic magnification factors, and found that slowly metabolized compounds biomagnify with close to 100 percent probability, almost regardless of their other properties. If an animal can metabolize the compound quickly, biomagnification becomes much less likely.
2. It is retained in tissue. Most classic biomagnifying pollutants are hydrophobic and dissolve into body fat.
Chemists measure that with log Kow, the octanol-water partition coefficient, and a log Kow above 5 is the international screening trigger for bioaccumulation risk. In the 2016 global synthesis of organic chemicals, the highest trophic magnification factors occurred mainly between log Kow 6 and 8.
Fat is not the only route to retention. Some PFAS are held instead by binding tightly to proteins.
3. It persists in the environment. Under the Stockholm Convention, a chemical counts as persistent if its half-life is more than two months in water or more than six months in soil or sediment.
Persistence does not cause magnification by itself. It keeps the exposure going long enough for magnification to matter.
4. It leaves the body slowly. Retention only matters if elimination is slow to match.
Stored compounds sit in tissue instead of leaving in urine, sometimes for years. Human blood half-lives run from roughly two to eight years for PFOA and PFOS, and considerably longer for some other PFAS.
Where the Toxins Come From
| Source | Examples | Main route into food webs |
|---|---|---|
| Pesticides | DDT, dieldrin, chlordane | Runoff into streams and estuaries |
| Industrial chemicals | PCBs, PBDE flame retardants | Old equipment, landfills, sediment |
| Combustion | Mercury, dioxins, furans | Air, then rainfall into water |
| Consumer products | PFAS from coatings and foams | Wastewater and firefighting foam sites |
| Mining and smelting | Mercury, cadmium, arsenic | Tailings and acid drainage |
There is a detail here that surprises most people. Many of these chemicals do not stay near where they were used. Semi-volatile pollutants evaporate in warm regions, drift north in the atmosphere, and condense out in the cold.
Scientists call this the grasshopper effect. It is why the Stockholm Convention screens for an atmospheric half-life greater than two days. It is also why some of the highest pollutant body burdens on Earth are found in the Arctic.
Real Examples of Biomagnification
DDT and the Bald Eagle

DDT is the classic case, and it is the reason biomagnification became a household idea.
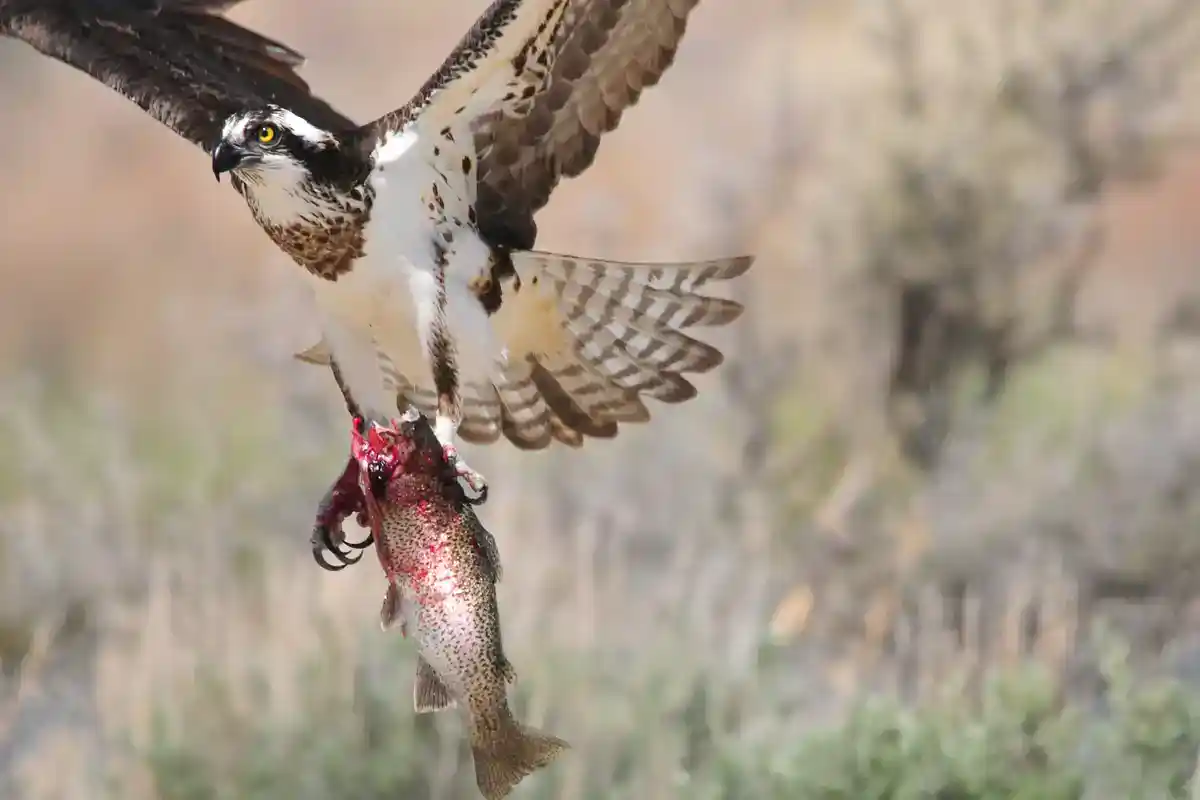
Farmers sprayed DDT widely from the 1940s, and it washed into lakes, rivers, and estuaries. It magnified up aquatic food chains into fish, and from fish into fish-eating birds such as eagles, ospreys, and pelicans. What Do Eagles Eat? Fish make up the bulk of the diet, which is exactly why they were hit so hard.
Peregrine falcons took a different route. They prey almost entirely on other birds, so their DDT arrived through contaminated bird prey, including migratory species that had fed in sprayed areas.
The damage came from DDE, a breakdown product of DDT. The US Fish and Wildlife Service explains the mechanism plainly: “DDE prevents normal calcium deposition during eggshell formation, resulting in thin-shelled eggs that are susceptible to breakage during incubation.” Parents crushed their own eggs while sitting on them.
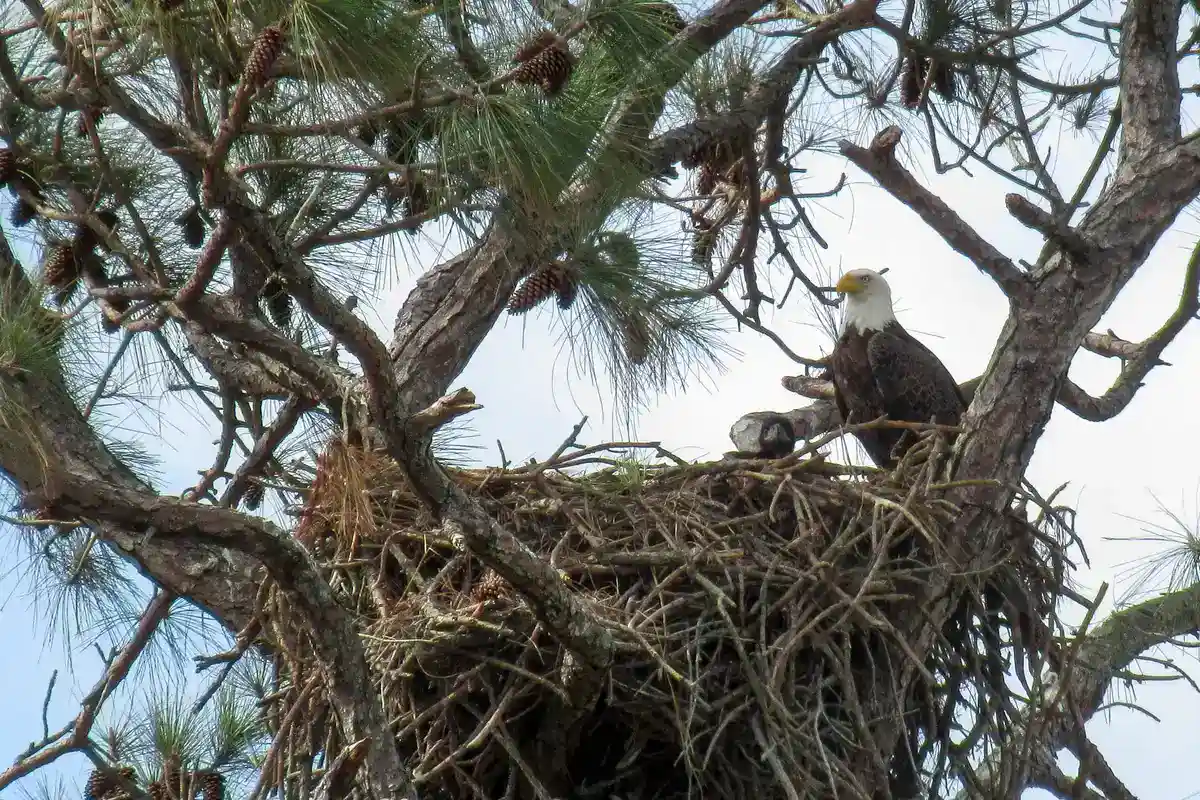
The dose-response data from bald eagle eggs is striking:
| DDE in eggs (ppm, wet weight) | Outcome |
|---|---|
| 3 or less | Near-normal production of young |
| 5 | About 10 percent eggshell thinning |
| More than 15 | Reproductive failure approaching 100 percent |
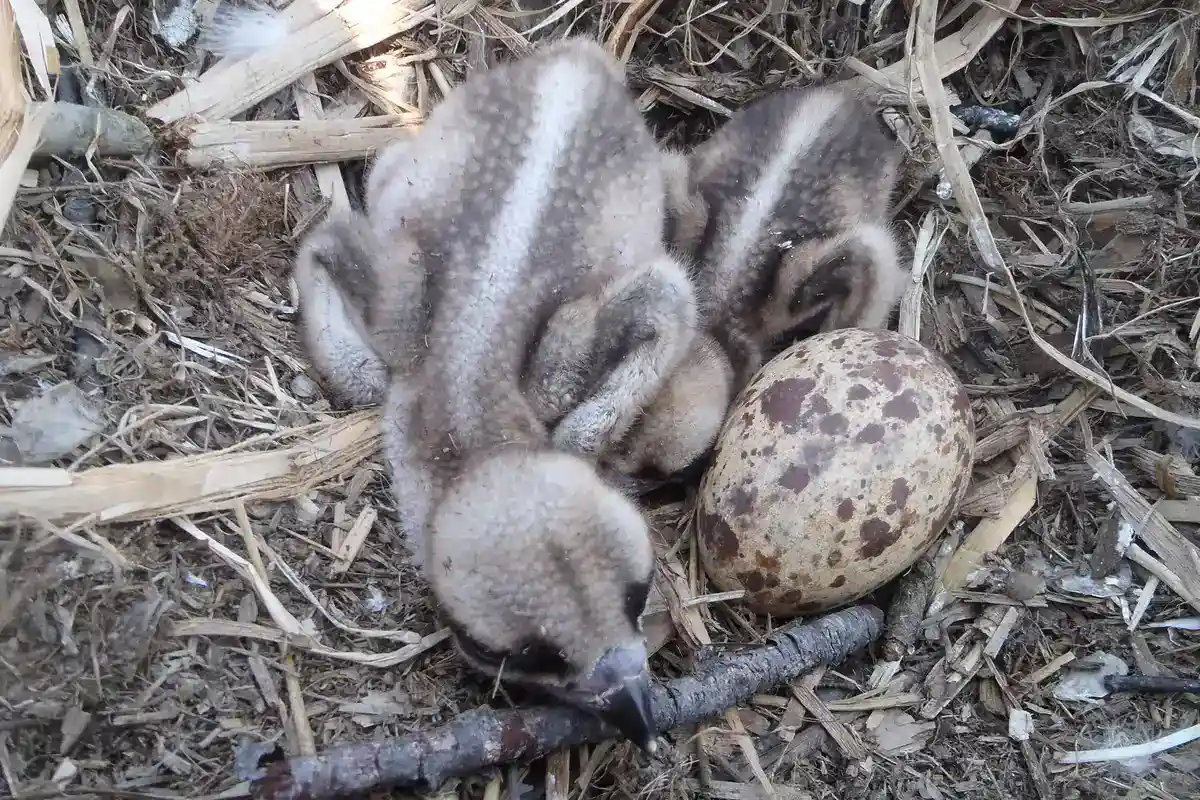
For peregrine falcons, populations declined when average eggshells ran more than 17 percent thinner than pre-DDT eggs. By 1963 only 417 nesting pairs of bald eagles remained in the lower 48 states.
In 1964, surveys of 133 formerly used peregrine falcon nest sites across the eastern United States and the Canadian Maritime Provinces found not a single active one.
EPA announced the final cancellation of all remaining crop uses of DDT on June 14, 1972. The ban took effect on December 31, 1972.
Removing DDT was the turning point, but it did not act alone. Endangered Species Act protection, nest site protection, captive breeding, reintroduction, and law enforcement all contributed. Together they allowed both species to rebound.
Peregrine falcons reached 1,650 known breeding pairs in the United States and Canada by 1998 and were removed from the endangered species list in 1999. Bald eagles were delisted in 2007, and survey data from 2018 and 2019 put the lower 48 population above 71,000 breeding pairs. That recovery is why bald eagles now appear on almost every list of Types of Eagles.
Here is the part that gets left out. DDT has not gone away. DDT waste was dumped at sea off Southern California decades ago.
A 2024 study of that region found DDT and its breakdown products in 93 percent of fish samples collected between 1998 and 2021. Sediment concentrations reached 5,182 nanograms per gram dry weight. More than half a century after dumping stopped, the map of contamination still matches the map of the dump sites.
Mercury in Fish
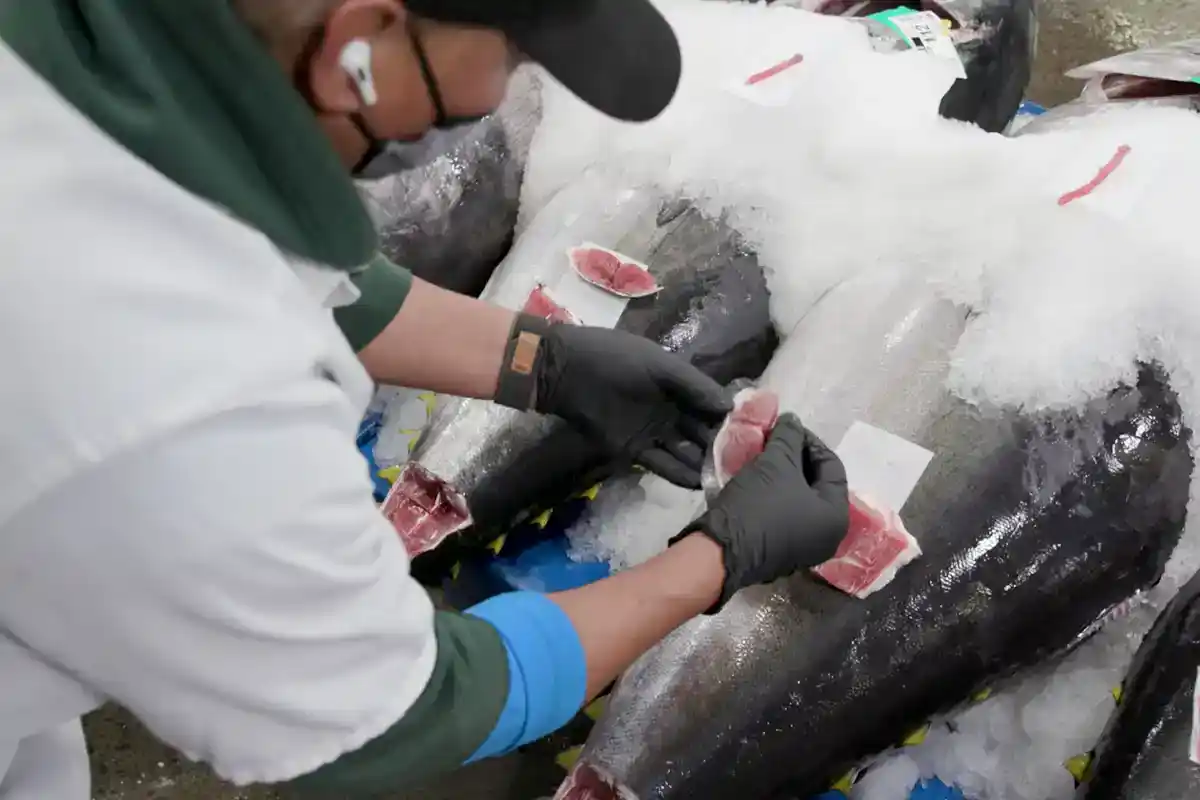
Methylmercury is the metal-associated contaminant that most consistently biomagnifies across aquatic food webs. The reason is chemistry.
Coal burning and mining release inorganic mercury into the air, and it settles into water and sediment. There, anaerobic microbes carrying the hgcAB genes convert it into methylmercury. Sulfate-reducing bacteria do part of this work, as do iron-reducing bacteria and methanogens, especially in wetlands, thermokarst ponds, and lake sediments.
That conversion changes everything. Methylmercury has a carbon atom attached, so it behaves like an organic molecule. It crosses gut walls easily, binds to proteins in muscle, and leaves the body very slowly.
Animals cannot regulate it the way they regulate copper or zinc. The US Geological Survey states the result directly: “Methylmercury levels in predatory fish are typically more than one million times higher than methylmercury levels in water that the fish inhabit.”
EPA’s national bioaccumulation factors put numbers on the climb. Trophic level 3 fish sit at 680,000 liters per kilogram, and trophic level 4 fish sit at 2,670,000. Nearly 100 percent of the mercury in a top predator fish is the methyl form.
FDA monitoring data shows the pattern on a dinner plate:
| Fish | Mean mercury (ppm) | Rough trophic position |
|---|---|---|
| Shrimp | 0.009 | Low |
| Tilapia | 0.013 | Low |
| Salmon | 0.022 | Mid |
| Canned light tuna | 0.126 | Mid |
| Canned albacore tuna | 0.350 | Higher |
| Bigeye tuna | 0.689 | High |
| King mackerel | 0.730 | High |
| Shark | 0.979 | Top |
| Swordfish | 0.995 | Top |
| Tilefish (Gulf of Mexico) | 1.123 | Top |
Gulf tilefish carry roughly 125 times the mercury of shrimp. These are different species from different habitats, so the table is not itself a food web study and does not measure biomagnification directly.
What it does show is why long-lived predatory fish tend to carry far more mercury than animals near the bottom of the chain. What Do Shrimp Eat? Mostly algae, detritus and plankton, which is about as low on the chain as an animal can feed.
The human cost of ignoring this is documented. In Minamata, Japan, the Chisso chemical plant discharged methylmercury from acetaldehyde production into the bay from 1932. Local seafood carried 5.6 to 35.7 ppm of mercury.
Doctors officially identified the disease in May 1956, and discharges continued until 1968. By 1995, 2,252 patients had been officially certified and 1,043 of them had died. The Minamata Convention on Mercury was adopted in 2013 and now has more than 150 parties.
PCBs and Killer Whales
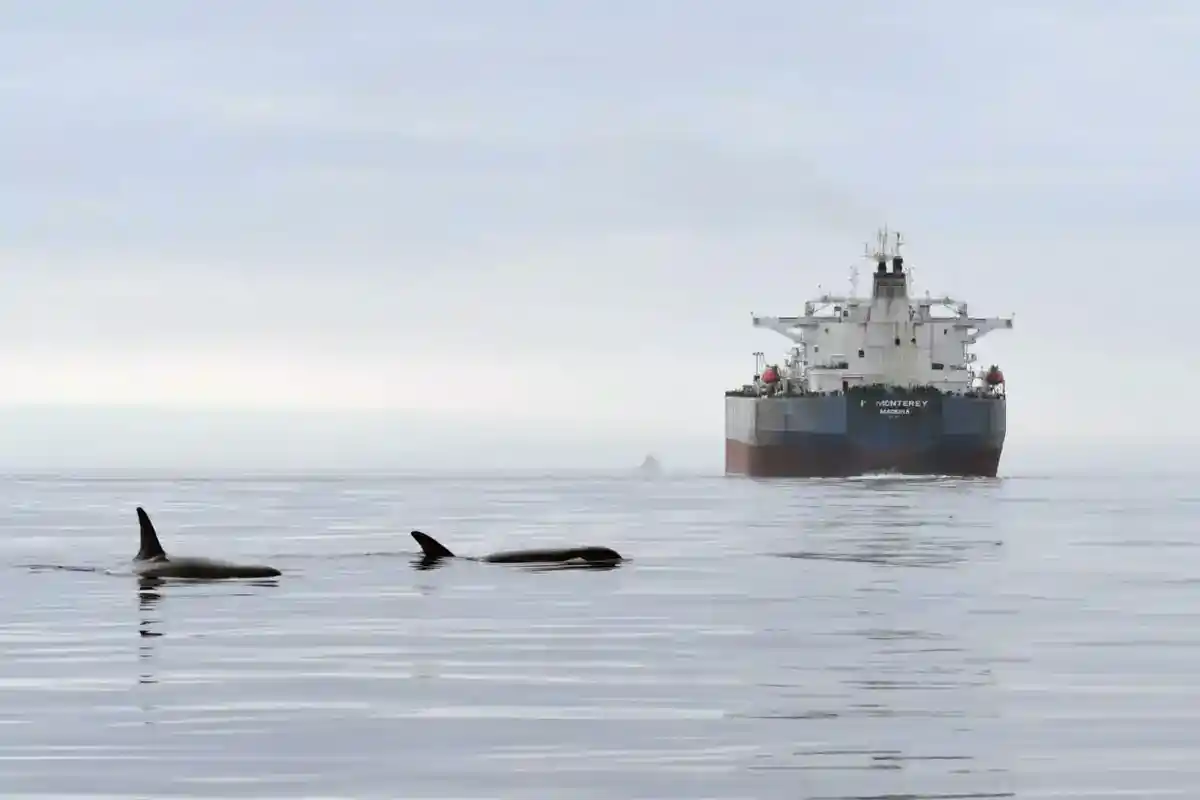
PCBs were used in transformers, capacitors, paints, and hydraulic fluids. The United States banned manufacture under the Toxic Substances Control Act of 1976, with the ban effective in 1979.
They have not left the ocean. NOAA measured average summed PCBs of about 45 micrograms per gram lipid weight in male Southern Resident killer whales sampled between 2004 and 2013.
Diet drives the difference. What Do Killer Whales Eat? It depends entirely on the population, and that turns out to matter enormously.
In Norwegian waters, killer whales that eat seals carried about 46 micrograms per gram lipid weight of PCBs. Killer whales in the same waters that eat fish carried about 11. Four times the load, consistent with feeding on higher-trophic-level prey.
A 2018 study in Science looked at PCB effects on reproduction and immune function. It concluded that more than half of the world’s killer whale populations face collapse risk over the next hundred years. The authors called it “the troubling persistence of this chemical class” more than 30 years after a near-global ban.
Mothers pass the burden on. Killer whale milk is made partly from blubber, so a female transfers a share of her lifetime pollutant load to her first calf. Patterns like this are a core topic in Marine Biology 101.
PFAS in the Arctic
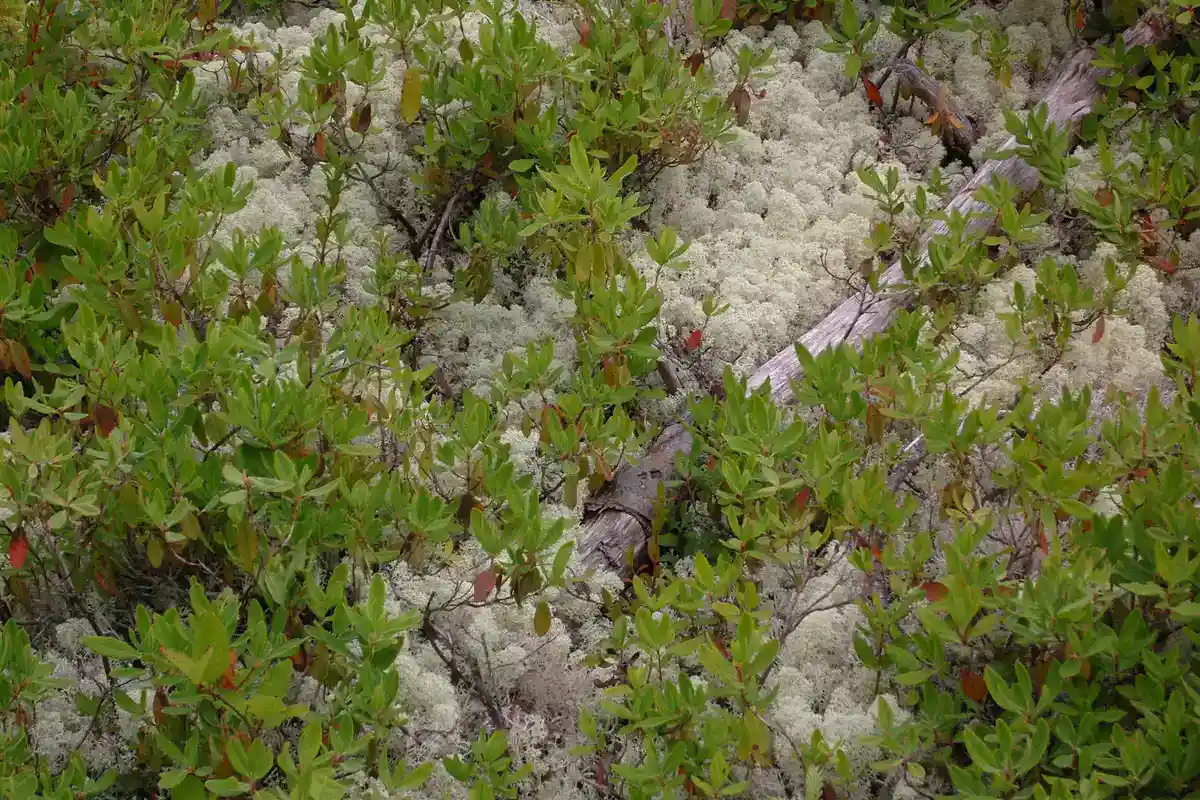
PFAS are sometimes called forever chemicals. Some of them biomagnify, but they break the usual rules.
Researchers traced perfluorinated compounds through a pure terrestrial food chain: lichen, then caribou, then wolves. Vegetation held 0.02 to 0.26 nanograms per gram wet weight of perfluorocarboxylic acids, and wolf liver held 10 to 18.
Trophic magnification factors ran from 2.2 to 2.9 for the longer-chain compounds and 2.3 to 2.6 for PFOS. What Do Wolves Eat? Caribou, mostly, which is the link that carries the contaminant up.
Chain length matters within a chemical family. Among the perfluorocarboxylic acids, PFOA with its eight carbons did not magnify significantly, while the longer C9 to C13 compounds did.
PFOS is also an eight-carbon molecule, but it is a sulfonate rather than a carboxylic acid, and it biomagnified in the same study.
Unlike classic fat-loving pollutants, the perfluoroalkyl acids discussed here do not mainly collect in fat. They bind strongly to serum and tissue proteins, so they concentrate in blood, liver, and kidney.
That means the tissue you sample matters, and the lipid-normalization step used for PCBs and DDT does not work for these compounds.
EPA set enforceable drinking water limits in April 2024: 4.0 parts per trillion each for PFOA and PFOS. In May 2026 EPA proposed keeping those limits while giving qualifying water systems until April 2031 to comply. That proposal has not been finalized.
PCBs in the Lichen, Caribou, and Wolf Chain

EPA documents the same Arctic route for PCBs with numbers worth memorizing. Caribou in Canada’s Northwest Territories carried up to 10 times the PCB levels found in the lichen they grazed on. The wolves that ate those caribou carried nearly 60 times the lichen concentration.
Three trophic levels. A sixty-fold increase, in a remote Arctic food web far from the industrial sources of these pollutants. Surviving there at all depends on a long list of Tundra Animal Adaptations.
How Scientists Measure Biomagnification
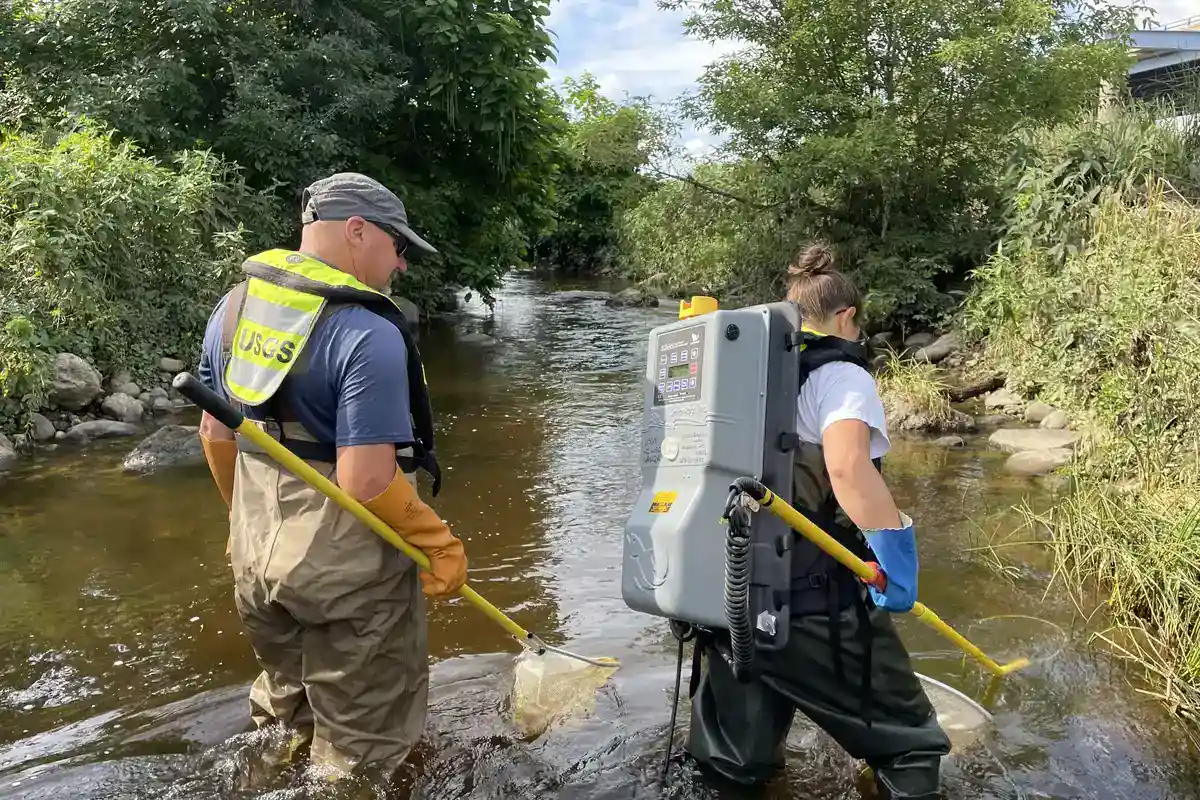
Four metrics do most of the work. Knowing what each one compares is the key.
| Metric | Full name | What it compares | Magnification when |
|---|---|---|---|
| BCF | Bioconcentration factor | Organism vs. surrounding medium, excluding diet. Usually water in aquatic studies | Not applicable |
| BAF | Bioaccumulation factor | Organism vs. surrounding medium, including all uptake routes | Not applicable |
| BMF | Biomagnification factor | Consumer vs. its diet | BMF greater than 1 |
| TMF | Trophic magnification factor | Concentration vs. trophic level, across a whole food web | TMF greater than 1 |
TMF is the preferred field metric because it describes an entire food web rather than one predator-prey pair. A TMF of 3.8 means concentration roughly quadruples with each step up.
Researchers cannot simply ask an animal what it eats, so they use nitrogen isotopes. The heavier isotope nitrogen-15 gets enriched slightly in tissue at each trophic transfer.
Scientists measure the ratio, written as delta 15N, and use it to place every organism on a continuous trophic scale. A value of about 3.4 parts per thousand per trophic step is the standard default when the system has not been measured directly.
Real values range from about 3 to over 5, so the default is a working assumption rather than a constant. Researchers then plot the log of concentration against trophic level, and the antilog of the slope is the TMF.
What Does Not Biomagnify
This section matters as much as the examples, because a lot of published material gets it wrong.
Most Metals Do Not Biomagnify
A 2025 study measured 18 trace elements across 31 freshwater sites. Mercury was the only element that biomagnified across those sites, with a median TMF of 3.77, and selenium came out flat at 1.01. All 16 remaining elements biodiluted, meaning concentrations fell as trophic level rose.
Do not read that as a universal law. Marine studies have reported trophic magnification of lead and zinc in some food webs, and copper and zinc factors above 1 in others. The defensible statement is narrower: most trace elements do not show the consistent, strong food web magnification seen with methylmercury, and results vary with the element, the species, the tissue sampled, and the ecosystem.
The reason is that organisms handle metals actively. Many species regulate, sequester, detoxify, or eliminate them using metal-binding proteins, intracellular granules, storage tissues, and excretory pathways. These processes differ a great deal between metals and between species.
Methylmercury behaves differently. It is efficiently absorbed, binds strongly to proteins, and is eliminated slowly, and that combination is what favors trophic magnification.
Cadmium is strongly context dependent. It usually biodilutes, but US Geological Survey researchers documented genuine cadmium biomagnification in specific epiphyte-based freshwater food webs, with a 15-fold rise across two trophic links. Whether it magnifies depends on the food web, not on the metal alone.
Lead does not show consistent biomagnification. It tends to accumulate disproportionately in calcified tissues and gills, and most freshwater food web studies find it biodilutes rather than magnifies. Some marine food webs are exceptions, which is why the wording here is cautious.
Plants Do Not Biomagnify
This is a real accuracy point, and it trips up a lot of study guides.
Biomagnification is defined by comparing a consumer to its prey. Plants are primary producers at trophic level 1. They have no prey, so they cannot biomagnify anything through feeding.
What they do instead is bioconcentrate and bioaccumulate contaminants from soil, water, and air. The correct measurement is a bioconcentration factor or a soil-to-plant transfer factor, not a BMF or TMF.
Plants matter enormously anyway, because they are the contaminated starting point that everything above them feeds on.
Rice is the best example. Flooded paddy soil is anaerobic, which converts arsenic into the mobile arsenite form. Rice is also a silicon accumulator, and arsenite is chemically similar to silicic acid.
Rice’s silicon transporters, Lsi1 and Lsi2, carry arsenite into the grain by mistake. The FDA set an action level of 100 parts per billion inorganic arsenic in infant rice cereal in 2020. That is bioconcentration from soil, not biomagnification up a food chain.
Shellfish Toxins: Often Trophic Transfer Rather Than Biomagnification
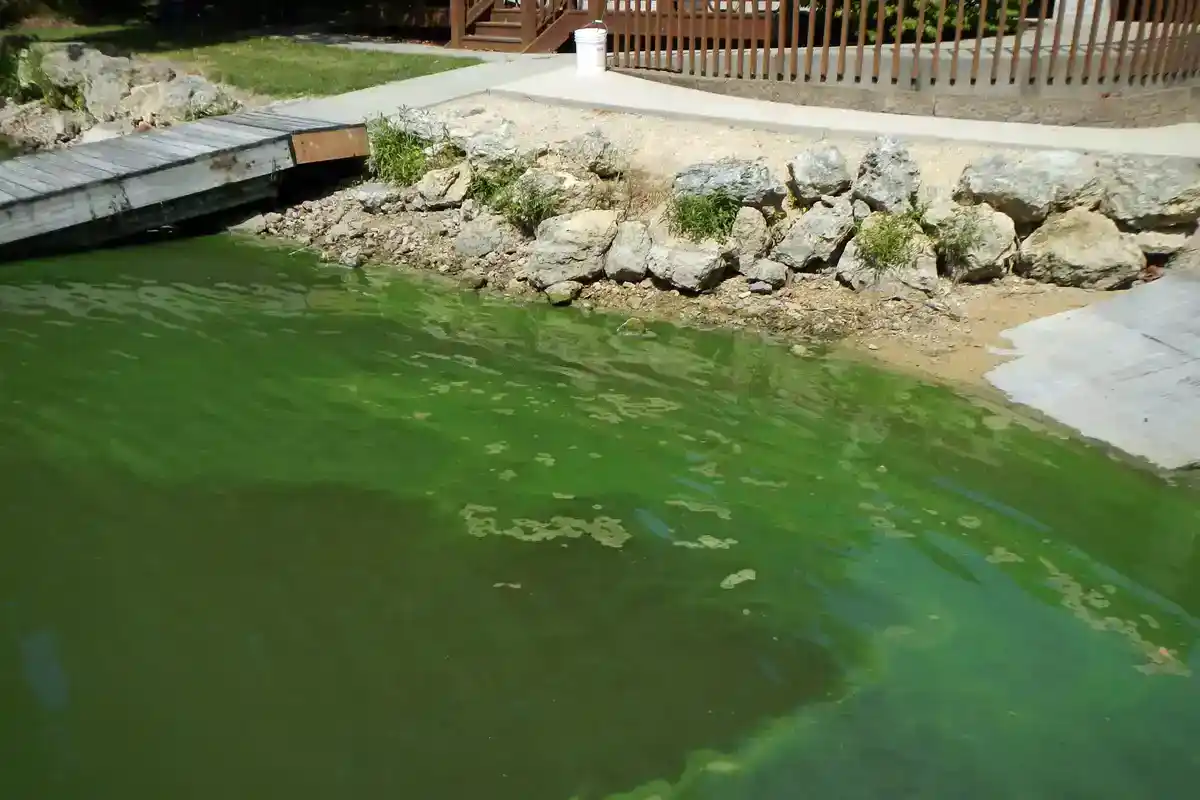
Harmful algal blooms produce domoic acid, saxitoxin, and brevetoxin. Filter-feeding shellfish concentrate these toxins to dangerous levels, and people get sick. All of that is true.
These events often involve trophic transfer rather than classic biomagnification. In one study of saxitoxin across a marine food web, the highest concentrations occurred in filter-feeding bivalves at trophic level 2.
Concentrations then fell going up through gastropods, echinoderms, cephalopods, and fish. The controlling factor there was filtration rate, not trophic position. Other papers do describe algal toxins magnifying up food webs, so this is a common pattern rather than a rule.
For events like these, trophic transfer or vectoring is often the more accurate description. A filter feeder concentrates the toxin fast and clears it slowly. A predator then eats a lot of contaminated prey in a short time and gets an acute dose.
The 1998 California sea lion die-off shows how trophic transfer can deliver a dangerous dose without classic stepwise biomagnification. More than 400 sea lions died from domoic acid poisoning. The route was a bloom of the Diatom Pseudo-nitzschia australis, into northern anchovies, into sea lions.
Blue mussels sampled during the outbreak contained no domoic acid or only trace amounts. The standard shellfish monitoring program missed the whole event. FDA action levels in shellfish are 20 mg/kg for domoic acid and 0.8 mg/kg saxitoxin equivalent.
Effects on Wildlife
Reproductive effects are the best documented. Eggshell thinning from DDE is the textbook case. Many persistent pollutants disrupt hormone signaling, which shows up as reduced fertility, developmental abnormalities, and failed pregnancies.
In killer whales, reproductive failure is the specific mechanism projected to drive population collapse. The hormone systems involved are covered in these Endocrine System Fun Facts.
Immune defenses can weaken. Some persistent organic pollutants impair immune function, which can raise susceptibility to infection. The size of the effect varies with the compound, the dose, and the species, as these Immune System Fun Facts explain.
Maternal transfer moves the burden to the young. Fat-soluble pollutants move into milk and into eggs. A newborn can start life with a substantial pollutant load, and first-born calves of marine mammals typically receive the largest share.
Fasting makes it worse. In Arctic animals, burning stored fat during winter releases pollutants that were locked in that fat straight into the bloodstream. EPA notes this specifically for Alaskan mammals.
Population effects follow individual effects. When a top predator declines, the effects can ripple down through the food web. Loss of an apex predator may change prey populations, which in turn changes vegetation or plankton communities. These cascades are documented but not automatic.
Effects on Human Health
Humans eat high on the food chain, so we are exposed to the same magnified loads.
Seafood is the main route of methylmercury exposure for most people. Methylmercury crosses the placenta and affects the developing nervous system. FDA and EPA advise two to three servings a week from their Best Choices list for people who are pregnant or breastfeeding.
They also name seven fish to avoid. Those are king mackerel, marlin, orange roughy, shark, swordfish, Gulf of Mexico tilefish, and bigeye tuna. The point is not to avoid fish, because fish is good food, but to choose fish lower on the food chain.
Fresh water carries its own advisories. General Electric discharged as much as 1.3 million pounds of PCBs into the Hudson River, and cleanup has helped. More than 80 percent of Upper Hudson sport fish tested between 2020 and 2022 came in below 1.0 ppm PCBs, compared with typically at or above that level in 2015.
EPA’s remedial action objective for fish tissue at this site is 0.05 ppm PCBs. That level was set for an adult eating about 51 half-pound meals a year, which works out to roughly one a week.
Two interim targets are tied to lower eating rates. A level of 0.2 ppm is protective at one half-pound meal per month, and 0.4 ppm is protective for the average angler eating one half-pound meal every two months.
The fish are improving but have not reached those goals. About half the Upper Hudson sport fish sampled from 2020 to 2022 were still above 0.5 ppm. New York therefore continues to advise people not to eat fish from the Upper Hudson.
Some Arctic communities face unusually high exposure. Inuit and other circumpolar peoples live thousands of miles from heavy industry, yet they carry some of the highest persistent organic pollutant body burdens on Earth.
The reason is the combination of long-range atmospheric transport and a traditional diet built on seals, whales, and fish at trophic levels 4 and 5. What Do Seals Eat? Fish and squid, mostly, which places seals themselves high on the chain.
This deserves care rather than alarm. Arctic health authorities consistently stress that traditional foods carry major nutritional and cultural value, and that risk should never be presented without that benefit alongside it.
The Guam case is compelling but unresolved. A 2003 study in the Proceedings of the National Academy of Sciences traced the neurotoxin BMAA up a food chain in Guam. Free-living Cyanobacteria held 0.3 micrograms per gram, cycad seed coats held 1,161, and flying foxes held 3,556.
The authors linked this to an extraordinarily high rate of ALS-parkinsonism-dementia among the Chamorro people. That study reported a striking concentration gradient.
Both the interpretation of those BMAA measurements and the proposed link to ALS-parkinsonism-dementia remain disputed. A 2017 EPA-led critical review concluded the causal hypothesis is not supported by existing data, and the original authors published a detailed rebuttal in 2021. Treat it as an open question, not a settled fact.
Trimming fat and skin from fish before cooking lowers fat-soluble pollutants such as PCBs. It does not lower methylmercury, which is spread through the muscle itself. To cut methylmercury exposure, choose lower-mercury species and follow the recommended serving sizes and eating frequencies.
How to Reduce Biomagnification
Stop the release at the source. This is the most effective long-term measure. Banning DDT was the turning point for bald eagles and peregrine falcons, though legal protection and active recovery programs did the rest of the work.
Banning PCBs started a slow decline in marine mammal burdens. Downstream measures help, but none of them match source control. Chemical policy sits near the top of almost every list of Current Environmental Issues.
Regulate for bioaccumulation, not just toxicity. A chemical that is mildly toxic but magnifies 100-fold can do more damage than a more toxic chemical that breaks down in a week. The Stockholm Convention screens exactly this way, using half-life, log Kow, and long-range transport criteria alongside toxicity.
Design chemicals that break down. Compounds that metabolize quickly are far less likely to magnify, whatever their fat solubility. The 2016 global synthesis makes this the single most important lever.
Clean up the reservoirs. Contaminated sediment keeps feeding food webs for decades. Hudson River dredging cut PCBs in sport fish measurably, and the Southern California DDT data shows what happens when a reservoir is left in place.
Follow fish advisories. Choosing smaller, shorter-lived, lower-trophic-level fish cuts personal exposure immediately. Shrimp, tilapia, salmon, and sardines carry a fraction of the mercury of swordfish or shark.
What Do Salmons Eat? Mostly insects, plankton and smaller fish, which keeps them well below the top of the chain.
Monitor sentinel species. Eagles, otters, seals, and predatory fish reveal food-web contamination long before it shows up in people. Long-running monitoring programs are how the DDT decline was proven.
What Do Otters Eat? Fish, crabs and shellfish, which is exactly why they make such useful indicators of water quality.
Facts About Biomagnification
1. One of the biggest jumps happens at the very bottom. Everyone pictures magnification as a steady climb up the pyramid. In reality, for both mercury and selenium, one of the largest concentration steps is from water into microscopic algae.
EPA puts the methylmercury bioconcentration factor at the base of freshwater food webs at around 33,000. For selenium, EPA states that algae and other microorganisms accumulate it from water by factors ranging from several hundred to tens of thousands.
The per-trophic-level increases above it are generally much smaller than that initial water-to-biota concentration factor. Note that this bottom step is bioconcentration rather than biomagnification, since no feeding is involved.
2. Polar bears are efficient to a fault. A 2024 study of three zoo-housed bears measured lipid assimilation efficiency up to 99.5 percent and modeled limiting biomagnification factors up to 200. The digestive skill that keeps a polar bear alive is exactly what concentrates pollutants in it.
3. Warm-blooded food webs tend to magnify hardest. The 2016 global synthesis of more than 1,500 trophic magnification factors found the highest TMFs in food webs containing birds and mammals. Higher food requirements, differences in growth efficiency, and body temperature effects may all contribute.
4. Latitude does not predict it. The same synthesis found trophic magnification factors were unrelated to latitude. Arctic animals are heavily contaminated because pollutants travel there and because of what they eat, not because cold water magnifies more efficiently.
5. Hitchcock’s “The Birds” may have a real cause. In 1961 at Capitola, California, seabirds crashed into buildings and vomited anchovies. Alfred Hitchcock lived nearby and researched the event for his 1963 film.
In 2012, researchers found frustules of the toxin-producing diatom Pseudo-nitzschia in zooplankton samples preserved from that exact time and place.
6. Biomagnification is real but rarer than the internet suggests. An ecologist reviewed 148 papers with biomagnification in the title, and fewer than half actually demonstrated it. Much of the apparent magnification disappeared once results were corrected for the fat content of different species.
7. PCBs still threaten killer whales decades after they were banned. More than half of the world’s killer whale populations are projected to be at risk of collapse over the next century from PCBs alone.
Exam Questions, Answered
Define biological magnification.
Biological magnification is the progressive increase in the concentration of a substance in organisms at successively higher trophic levels of a food chain. It matters most for persistent contaminants that organisms absorb efficiently but excrete slowly.
Will the level of magnification be different at different levels of the ecosystem?
Yes. Concentration rises with each trophic level. Producers hold the least, primary consumers hold more, and top carnivores hold the most.
In the Long Island estuary study, plankton held 0.04 mg/kg of DDT and fish-eating birds held 24 mg/kg, a 600-fold increase across four levels.
Name two properties a compound must have to biomagnify.
It must resist metabolic breakdown, so the body cannot degrade and excrete it. And it must be retained in tissue rather than flushed out, which usually means it dissolves in fat, though PFAS achieve the same result by binding to blood proteins.
Environmental persistence accompanies both.
Give two suggestions to control biomagnification.
First, stop releasing persistent toxic chemicals at the source, through bans, discharge limits, and safer chemical design.
Second, clean up contaminated sediment and soil reservoirs, because they keep feeding food webs for decades after the original release stops.
Give an example of biological magnification and explain how it occurs.
DDT in bald eagles. DDT sprayed on farmland washed into waterways, plankton absorbed it, and small fish ate the plankton. Larger fish ate the small fish, and eagles ate the larger fish.
Because DDT is fat soluble and resists breakdown, it stayed in tissue at every step while the food itself was digested. Eagle eggs accumulated enough DDE to thin their shells, and the eggs broke during incubation.
USGS data shows 5 ppm of DDE in bald eagle eggs was associated with about 10 percent shell thinning, and above 15 ppm reproductive failure approached 100 percent. The US bald eagle population fell to 417 nesting pairs by 1963.
What is it called when toxins accumulate in an apex predator?
Biological magnification, also called biomagnification. If you are describing the buildup within that single animal over its lifetime rather than the increase across the food chain, the term is bioaccumulation.
How does biological magnification relate to persistence?
Two kinds of persistence matter, and they are not the same thing. Resistance to metabolism inside the body is the key biological requirement, because an animal that can break the chemical down will not accumulate much of it.
Persistence in the environment is what keeps the exposure going, so the chemical is still around to be eaten, re-eaten, and concentrated at every step.
Frequently Asked Questions
Bioaccumulation is the buildup of a chemical inside one organism over time, from all sources including water, air, and food. Biomagnification is the increase in concentration from one trophic level to the next. Bioaccumulation describes buildup within one organism, while biomagnification describes increasing concentration across trophic levels of a food web.
Persistent organic pollutants and methylmercury. The list includes DDT and its breakdown product DDE, PCBs, dioxins, PBDE flame retardants, chlordane, and longer-chain PFAS. These share resistance to metabolism, fat solubility or protein binding, and long environmental half-lives.
Methylmercury is the form that biomagnifies most strongly and most consistently. Measured trophic magnification factors run from about 1.2 in some Arctic marine food webs to about 4 in the Baltic and in many freshwaters. Inorganic mercury generally does not show the same trophic increase, and microbes in sediment and wetlands make the conversion that matters.
No. Methylmercury is the clearest and most consistent example, and most other trace elements either biodilute or behave differently depending on the ecosystem. A study of 18 trace elements across 31 freshwater sites found mercury was the only one that biomagnified there, while sixteen of the others biodiluted. Some marine food webs are exceptions, which is why the honest answer is context dependent rather than a flat no.
Not through feeding. Plants are primary producers at trophic level 1 and have no prey, so they cannot magnify a contaminant from a meal. They bioconcentrate and bioaccumulate contaminants from soil, water, and air, and they can then act as the contaminated base of a food web that does biomagnify. Arsenic in rice is a bioconcentration problem, not a biomagnification one.
It is much better documented in aquatic systems, partly because aquatic food chains are longer and partly because they are easier to study. It does happen on land, and the lichen to caribou to wolf chain in the Arctic shows clear magnification of both PCBs and PFAS. The strongest determinants are the properties of the chemical and how organisms process it.
Choose fish lower on the food chain, such as salmon, sardines, tilapia, shrimp, and canned light tuna. Follow local fish consumption advisories, especially for freshwater fish, and limit the seven fish FDA and EPA name as choices to avoid. Trimming fat and skin lowers fat-soluble pollutants such as PCBs, but it does not reduce methylmercury, which is spread through the muscle itself.
Partly, and slowly. Bald eagle and peregrine falcon recoveries after the 1972 DDT ban show that populations rebound when releases stop. But contaminated sediment keeps releasing chemicals for decades, and a 2024 analysis of fish sampled off Southern California between 1998 and 2021 found DDT and its breakdown products in 93 percent of samples. Prevention works far better than cleanup.
A TMF is a single number describing how much a chemical concentration changes per trophic level across an entire food web. It is calculated from the slope of log concentration plotted against trophic position, which researchers determine using nitrogen isotope ratios. A TMF above 1 means biomagnification, and a TMF below 1 means biodilution.
Key Takeaways
- Biological magnification is the increase in a chemical’s concentration at each step up a food chain.
- It is not the same as bioaccumulation, which is buildup inside a single organism from all sources.
- Chemicals magnify when organisms absorb them efficiently but metabolize and eliminate them slowly. Many are fat soluble or strongly protein binding, and environmental persistence keeps the exposure going.
- Resistance to metabolism is the strongest single predictor, ahead of fat solubility.
- DDT, PCBs, dioxins, PBDEs, longer-chain PFAS, and methylmercury are the main offenders.
- Most trace elements do not consistently biomagnify. Plants do not biomagnify contaminants through feeding. Many shellfish toxin events are trophic transfer rather than classic biomagnification.
- For contaminants that biomagnify strongly, top predators can carry the highest concentrations, which raises exposure for the people who eat them.
- Stopping releases at the source is the most effective long-term measure, and the one with the clearest record of reversing damage.
Cite this page
BioExplorer. (2026, September 14). What Is Biological Magnification?. https://www.bioexplorer.net/biological-magnification.html/
About the author